Design team members: David Kim, Theo Na, Sreeharsh Balakrishnan, Steven Sun
Supervisor: Yulia Gel
Background
When a six sided fair die is tossed, its outcome which consists of (1,2,3,4,5,6) are random. And just like a die, the movement of stock price is also random – meaning at any given point in time except in the past, we do not know whether the price will increase or decrease nor by how much.
However, if we look at stock charts, we observe trends and patterns. Some example of trends and patterns are the uptrends, downtrends, head and shoulders, double tops and double bottoms. If future stock prices were truly random, why are these trends and patterns occurring? Can we somehow take advantage of these trends and patterns and lessen the degree of uncertainty of stock prices so that ultimately, traders can use these trends to support their current trading strategies?
The goal is to introduce some kind of order to this quasi random behaviour of stocks so that traders can make informed intelligent decisions based on historical trends. Although the stock price movement is random, it is not completely random to the point of which we cannot observe trends or patterns. We cannot predict the future but when certain trends and patterns are apparent, we can use these historical data as a tool to forecast future stock prices. We call this method of analyzing security prices technical analysis.
Technical analysis is a relatively new school of thought in the financial market compared to the long standing fundamental analysis. While technical analysts look at charts, fundamental analysts look at financial statements such as Balance Sheets, Income Statements and Cash Flow Statements to gauge the financial health of a company and thus its intrinsic value. Using this approach, investment decisions are based by comparing the market value of the stock to its true intrinsic value.
Currently, many market participants combine both fundamental and technical analysis to trade and invest. In particular, they use technical analysis as a tool to support and confirm their trading strategies.
There are many products in the industry that perform stock analysis but none offer the support and resistance trend lines - this is currently manually done.
Project description
The goal of the project is to automate the identification of three trend lines; the support, the resistance and the channel. Once identified, the trend lines need to be drawn and the stocks ranked based on these stock trends. Two stocks can be ranked based on the slope which shows how fast the stock is rising or dropping in value and also on the width of the trend which shows the volatility. The wider the stock channel is, the higher the volatility is and the less attractive it becomes. Obviously, investors would want to invest in the stock in Figure 2 since it generates more return in the same period.
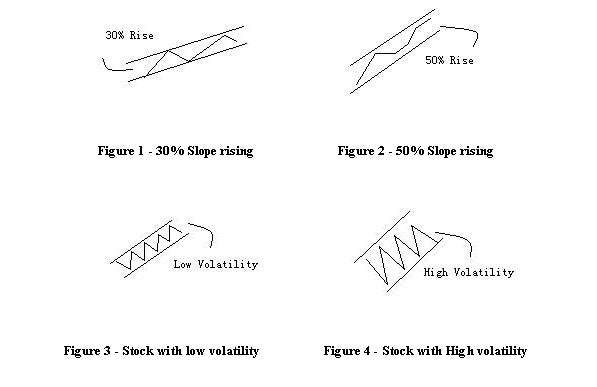
A stock with low volatility is always more welcomed by investors than the ones with high volatility. In technical analysis it is imperative to identify problem areas. One error or miscalculation could often lead to tremendous losses for those involved. Existing solutions have done a great job on analyzing stocks; however, improvements can still be made.
Design methodology
1. Pattern Recognition Logic The trend lines will be mathematically determined using statistics and pattern recognition concepts and theories. The ultimate goal is find an optimal trend line that will act as a support, resistance and channel. This boils down to estimating two parameters of the straight line, namely the intercept and the slope. Simple linear regression using Least Squares, Least Absolutes and Maximum Likelihood will be used as a starting point. To account for noise and outliers, more robust methods such as robust regression, M-estimators method will also be addressed as a method of estimating the parameters of the trend lines.
2. Implementation The implementation of the proposed project relies on several interacting software components to perform analysis and provide feedback to the user. The following figure depicts the proposed software architecture.
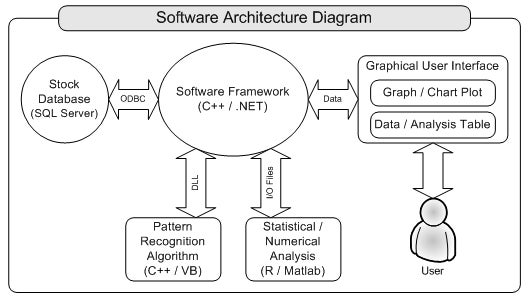
The architecture was designed with component modularization as a key focus; each major functionality is implemented in a separate component and interfaced to interact with others. Two, a modularized architecture leads to more reusable components. Having an independent module for the pattern recognition algorithm allows it to be used in other settings and architectures with minimal integration overhead. The following is a functional description of each component and its implementation strategy.
The Software Framework is the main component that controls the various interactions between other components, similar to a motherboard in a PC. The implementation technology of choice is C++ with the Microsoft .NET framework.
The Stock Database stores stock data that is retrieved by the main framework for analysis. It interfaces with the main framework using standard ODBC (Open Database Connectivity).
The Pattern Recognition Algorithm contains the main analysis logic to detect trends. Stock data is sent to the algorithm via the main framework and any recognized patterns are output in the form of raw numbers that are later processed by the main framework and displayed in the user interface.
The Statistical / Numerical Analysis module handles various analyses prior to and after algorithm processing. The algorithm may require sophisticated statistical and/or numerical analysis on the stock data before a pattern can be recognized, which is to be handled by this module
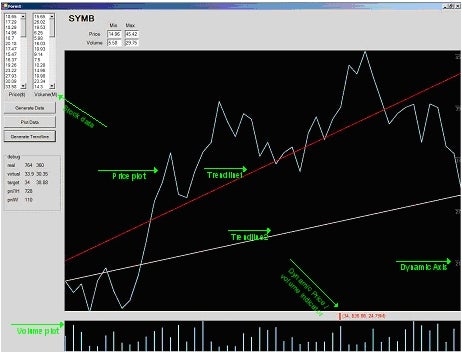
The Graphical User Interface is the component that the user interacts with, and is intended to encapsulate the lower-level details of the analysis. Commands and queries are to be performed through the user interface while its results are displayed in plots and tables. The following is a screen shot of the software Graphical User Interface.