Astrophysicists have filled in 11 billion years in our picture of the universe with the release of a comprehensive analysis of the largest three-dimensional cosmic map ever created.
“This is one of the most substantial advances in cosmology in the last decade,” said University of Waterloo professor Will Percival, a lead researcher on the work.
“Over the last 20 years, the Sloan Digital Sky Survey (SDSS) has created a series of surveys that now span a period of 11 billion years of cosmic history,” said Percival, who holds a joint position between the University of Waterloo and Perimeter Institute and is the Survey Scientist for the latest SDSS survey. “We have worked to fill in that gap, and we are now using that information to gain a better understanding of this period in our universe.”
The new results come from the extended Baryon Oscillation Spectroscopic Survey (eBOSS), an international collaboration of more than 100 astrophysicists that is one of the SDSS’s component surveys. At the heart of the new results are detailed measurements of more than two million galaxies and quasars covering 11 billion years of cosmic time.
The results represent the culmination of 15 years of work for Percival, who is the Director of the Waterloo Centre for Astrophysics at the University of Waterloo – where he holds the Mike and Ophelia Lazaridis Distinguished Chair in Astrophysics – and an associate faculty member at Perimeter. He has held various management roles within SDSS, including his current one on the eBOSS management team. As the collaboration prepared to simultaneously release 23 papers representing over 500 pages of new science, Percival was essentially tasked with ensuring the scientific rigour of their results.
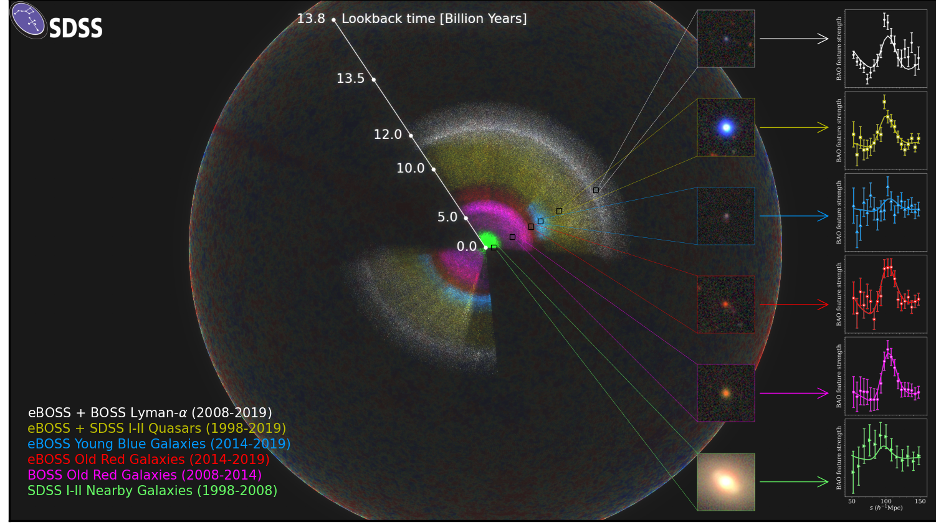
Image credit: Anand Raichoor (EPFL), Ashley Ross (Ohio State University) and the SDSS Collaboration*
In their analysis of the SDSS data, the eBOSS team has created a map (above) that reveals the filaments and voids that define the structure in the universe, starting from the time when the universe was only about 300,000 years old. From this map, researchers measure patterns in the distribution of galaxies, which give several key parameters of our universe to better than one percent accuracy. The signals of these patterns are shown in the insets in the image.
This map represents the combined effort of more than 20 years of mapping the universe using the Sloan Foundation telescope.
“The data released before now have significant legacy value, and have been widely used for many different astrophysical analyses from studies of individual stars through to studies of galaxies and the universe as a whole,” said Dustin Lang, a computational scientist at The Perimeter Institute who helped to put together this data. “It really is incredible that one experiment has produced such a scientific legacy.”
According to the cosmic history revealed in the eBOSS map, the expansion of the universe began to accelerate about six billion years ago and has continued to get faster and faster ever since. This accelerated expansion seems to be due to a mysterious invisible component of the universe called “dark energy,” consistent with Einstein’s General Theory of Relativity but extremely difficult to reconcile with our current understanding of particle physics.
Combining observations from eBOSS with studies of the universe in its infancy reveals cracks in this picture of the universe. In particular, the eBOSS team’s measurement of the current rate of expansion of the universe (the “Hubble Constant”) is about 10 percent lower than the value found from distances to nearby galaxies. The high precision of the eBOSS data means that it is highly unlikely that this mismatch is due to chance, and the rich variety of eBOSS data allows for multiple independent ways to draw the same conclusion. There is no broadly accepted explanation for this discrepancy in measured expansion rates, but one exciting possibility is that a previously unknown form of matter or energy from the early universe might have left a trace on our history.
Within the eBOSS team, individual groups at universities around the world focused on different aspects of the analysis. To create the part of the map dating back six billion years, the team used large, red galaxies. Farther out, they used younger, blue galaxies. Finally, to map the universe eleven billion years in the past and more, they used quasars, which are bright galaxies lit up by material falling onto a central supermassive black hole. Each of these samples required careful analysis in order to remove contaminants and reveal the patterns of the universe.
Faizan Mohammad, a postdoctoral researcher at the Waterloo Centre for Astrophysics at the University of Waterloo and an associate member of the Perimeter Institute, led one such analysis.
“The hardware used to make the observations itself leaves an imprint on the map,” said Mohammad. “It has been a lot of hard work to understand this imprint and remove it from the data, enabling robust measurements to be made about the universe.”
eBOSS, and SDSS more generally, leaves the puzzle of dark energy, and the mismatch of local and early universe expansion rate, as a legacy to future projects – such as the Dark Energy Spectroscopic Instrument (DESI) and EUCLID, a European Space Agency satellite mission, both of which Percival is involved in.
“We’re incredibly proud of the results from eBOSS, but also of the tools and mechanisms we’ve developed to analyze the data,” said Percival. “They will be an enormous asset as the next generation of galaxy surveys come online and attempt to resolve this conundrum – or, perhaps, reveal more surprises.”
In the media:
- Waterloo scientists help create 3D map of the universe [video], CBC News: The National, July 19, 2020
- Astrophysicists unveil biggest-ever 3D map of Universe, CTV News, July 19, 2020
- Astrophysicists Unveil Biggest-Ever 3D Map of the Universe, VOA News, July 19, 2020
-
Astrophysicists unveil biggest-ever 3D map of Universe, YAHOO! News, July 20, 2020
-
Astrophysicists fill in 11 billion years of the universe's expansion history, Phys.org, July 20, 2020
- Largest 3D map of universe released by astrophysicists, including UW prof, Kitchener Today, July 20, 2020
- Waterloo scientists help create 3D map of the universe [video], Channel 24, July 20, 2020