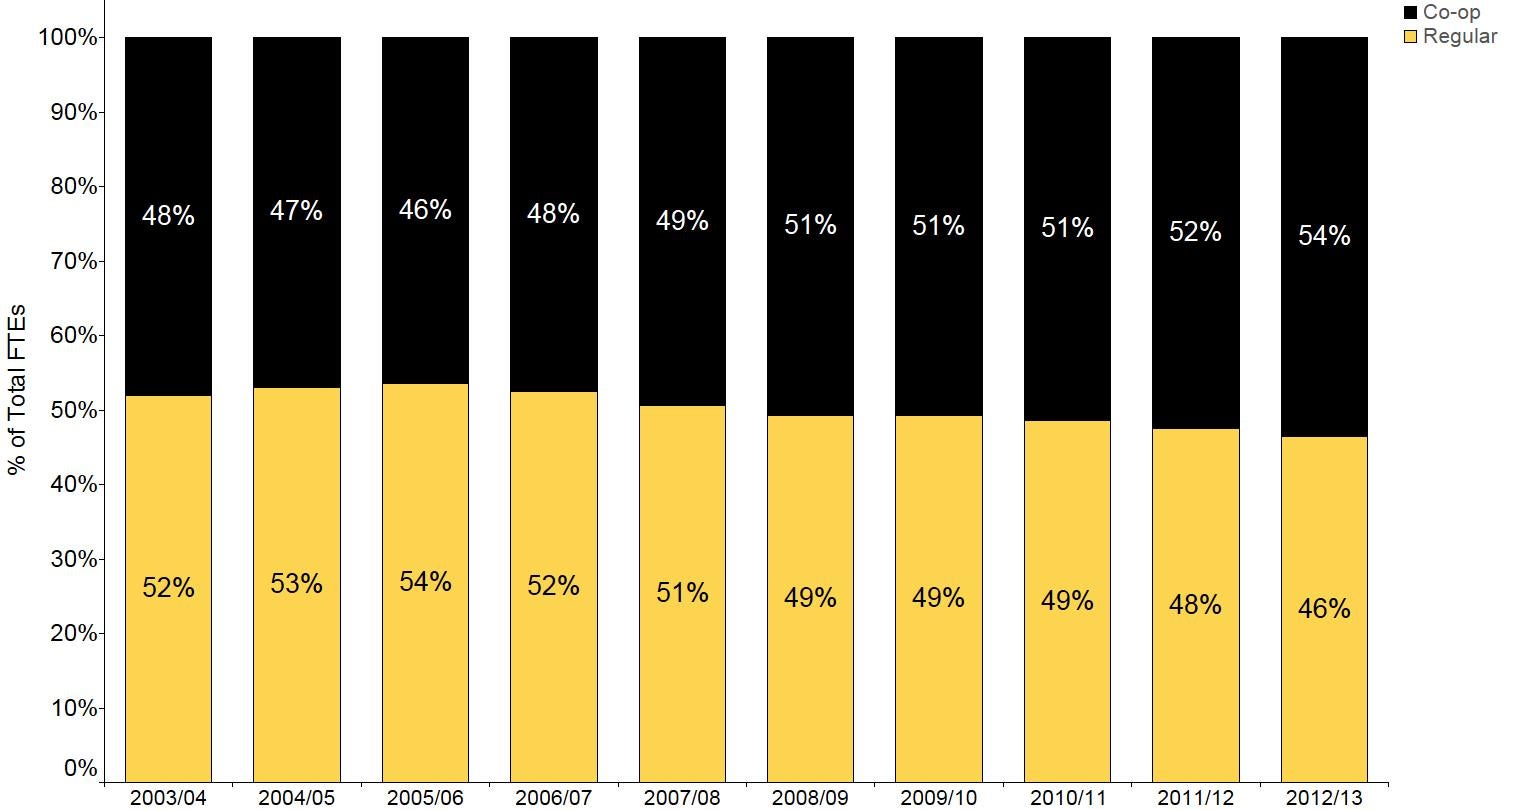
Percentage of undergraduate student FTEs by system of study

Definition
Ten year history of the percent of full-time equivalent (FTE) undergraduate students regular system of study (regular or co-op)
Data Sources
Student Administration System (SA) as of final government count date
Inclusions and Exclusions
Inclusions:
- Co-op includes students on a work term and students scheduled for an official work term regardless of whether or not they have a co-op job as of count date
- Non co-op Engineering enrolment is reported in the co-op total; these are generally non-degree and qualifying students
Exclusions
- Cross Registered students are excluded (e.g. Laurier)
Data Table
| Fiscal Year | Co-op | Regular |
|---|---|---|
| 2003/04 | 48% | 52% |
| 2004/05 | 47% | 53% |
| 2005/06 | 46% | 54% |
| 2006/07 | 48% | 52% |
| 2007/08 | 49% | 51% |
| 2008/09 | 51% | 49% |
| 2009/10 | 51% | 49% |
| 2010/11 | 51% | 49% |
| 2011/12 | 52% | 48% |
| 2012/13 | 54% | 46% |