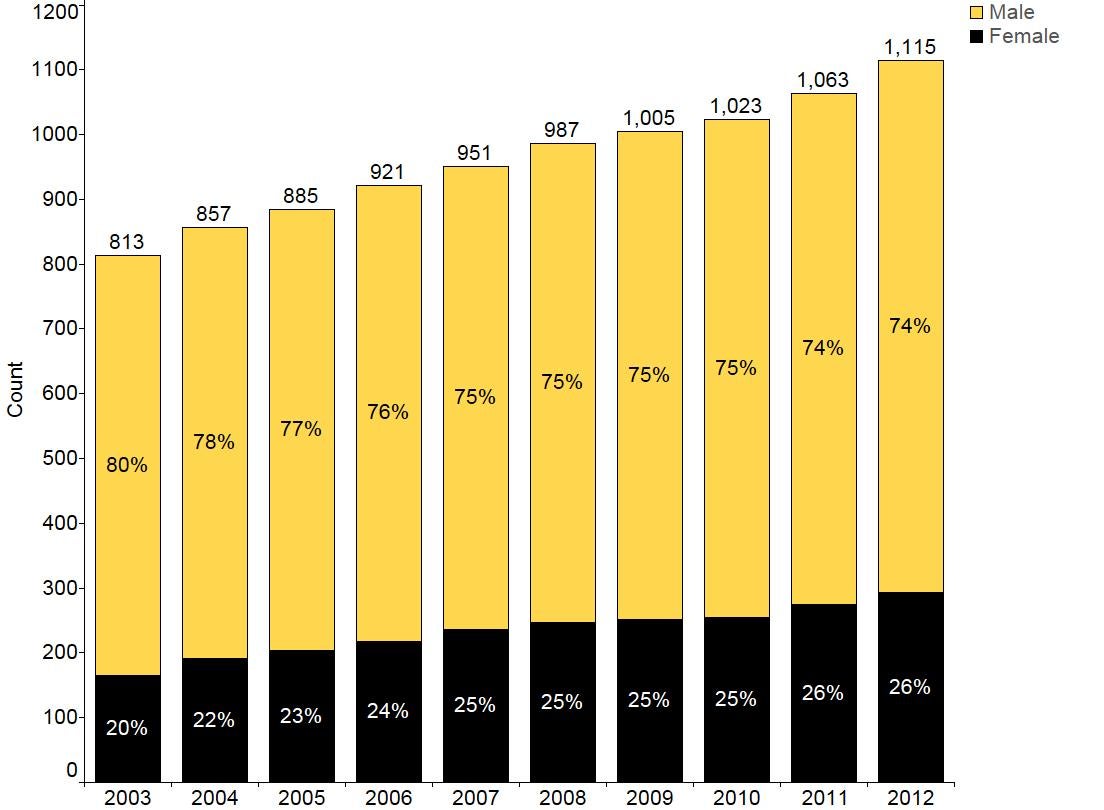
Full-time faculty members by gender

Definition
Ten year history of the count of all full-time faculty members with a regular appointment type, and with an appointment of at least 12 months
Data Sources
Statistics Canada University and College Academic Staff System (UCASS) submissions
Inclusions and Exclusions
Inclusions:
- Regular, full-time faculty with an appointment of at least 12 months
Exclusions:
- Visitors and researchers reported in University and College Academic Staff System (UCASS)
- University and College Academic Staff System (UCASS) excludes faculty members with senior administrative appointments above Dean level, faculty members with definitive term appointments of less than 12 months, and faculty members with part-time appointments (e.g. adjuncts/sessionals)
Data Table
| Year | % Male | Count of Males | % Female | Count of Females | Total Count |
|---|---|---|---|---|---|
| 2003 | 79.70% | 648 | 20.30% | 165 | 813 |
| 2004 | 77.71% | 666 | 22.29% | 191 | 857 |
| 2005 | 76.95% | 681 | 23.05% | 204 | 885 |
| 2006 | 76.33% | 703 | 23.67% | 218 | 921 |
| 2007 | 75.18% | 715 | 24.82% | 236 | 951 |
| 2008 | 74.97% | 740 | 25.03% | 247 | 987 |
| 2009 | 75.02% | 754 | 24.98% | 251 | 1,005 |
| 2010 | 75.07% | 768 | 24.93% | 255 | 1,023 |
| 2011 | 74.22% | 789 | 25.78% | 274 | 1,063 |
| 2012 | 73.63% | 821 | 26.37% | 294 | 1,115 |