In On the Origin of Species, Charles Darwin described the evolutionary relationships between organisms as branches on a tree, a diagrammatic representation of all species that have ever existed connected by common descent.
The affinities of all the beings of the same class have sometimes been represented by a great tree. I believe this simile largely speaks the truth. The green and budding twigs may represent existing species; and those produced during each former year may represent the long succession of extinct species.
— Charles Darwin, in On the Origin of Species
The metaphor has served biologists well, but reconstructing the tree of life’s many limbs, branches and twigs has not been straightforward. Evolutionary relationships between organisms thought to be true for decades have been overturned as new techniques using molecular biology coupled with computer science have been developed.
One such method — Deep Learning for Unsupervised Clustering of DNA Sequences, or DeLUCS for short — pioneered by Cheriton School of Computer Science Professor Lila Kari, her PhD students Pablo Millán Arias and Fatemeh Alipour, and her colleague Professor Kathleen Hill at Western University’s Department of Biology uses unsupervised machine learning to determine taxonomic relationships between organisms.

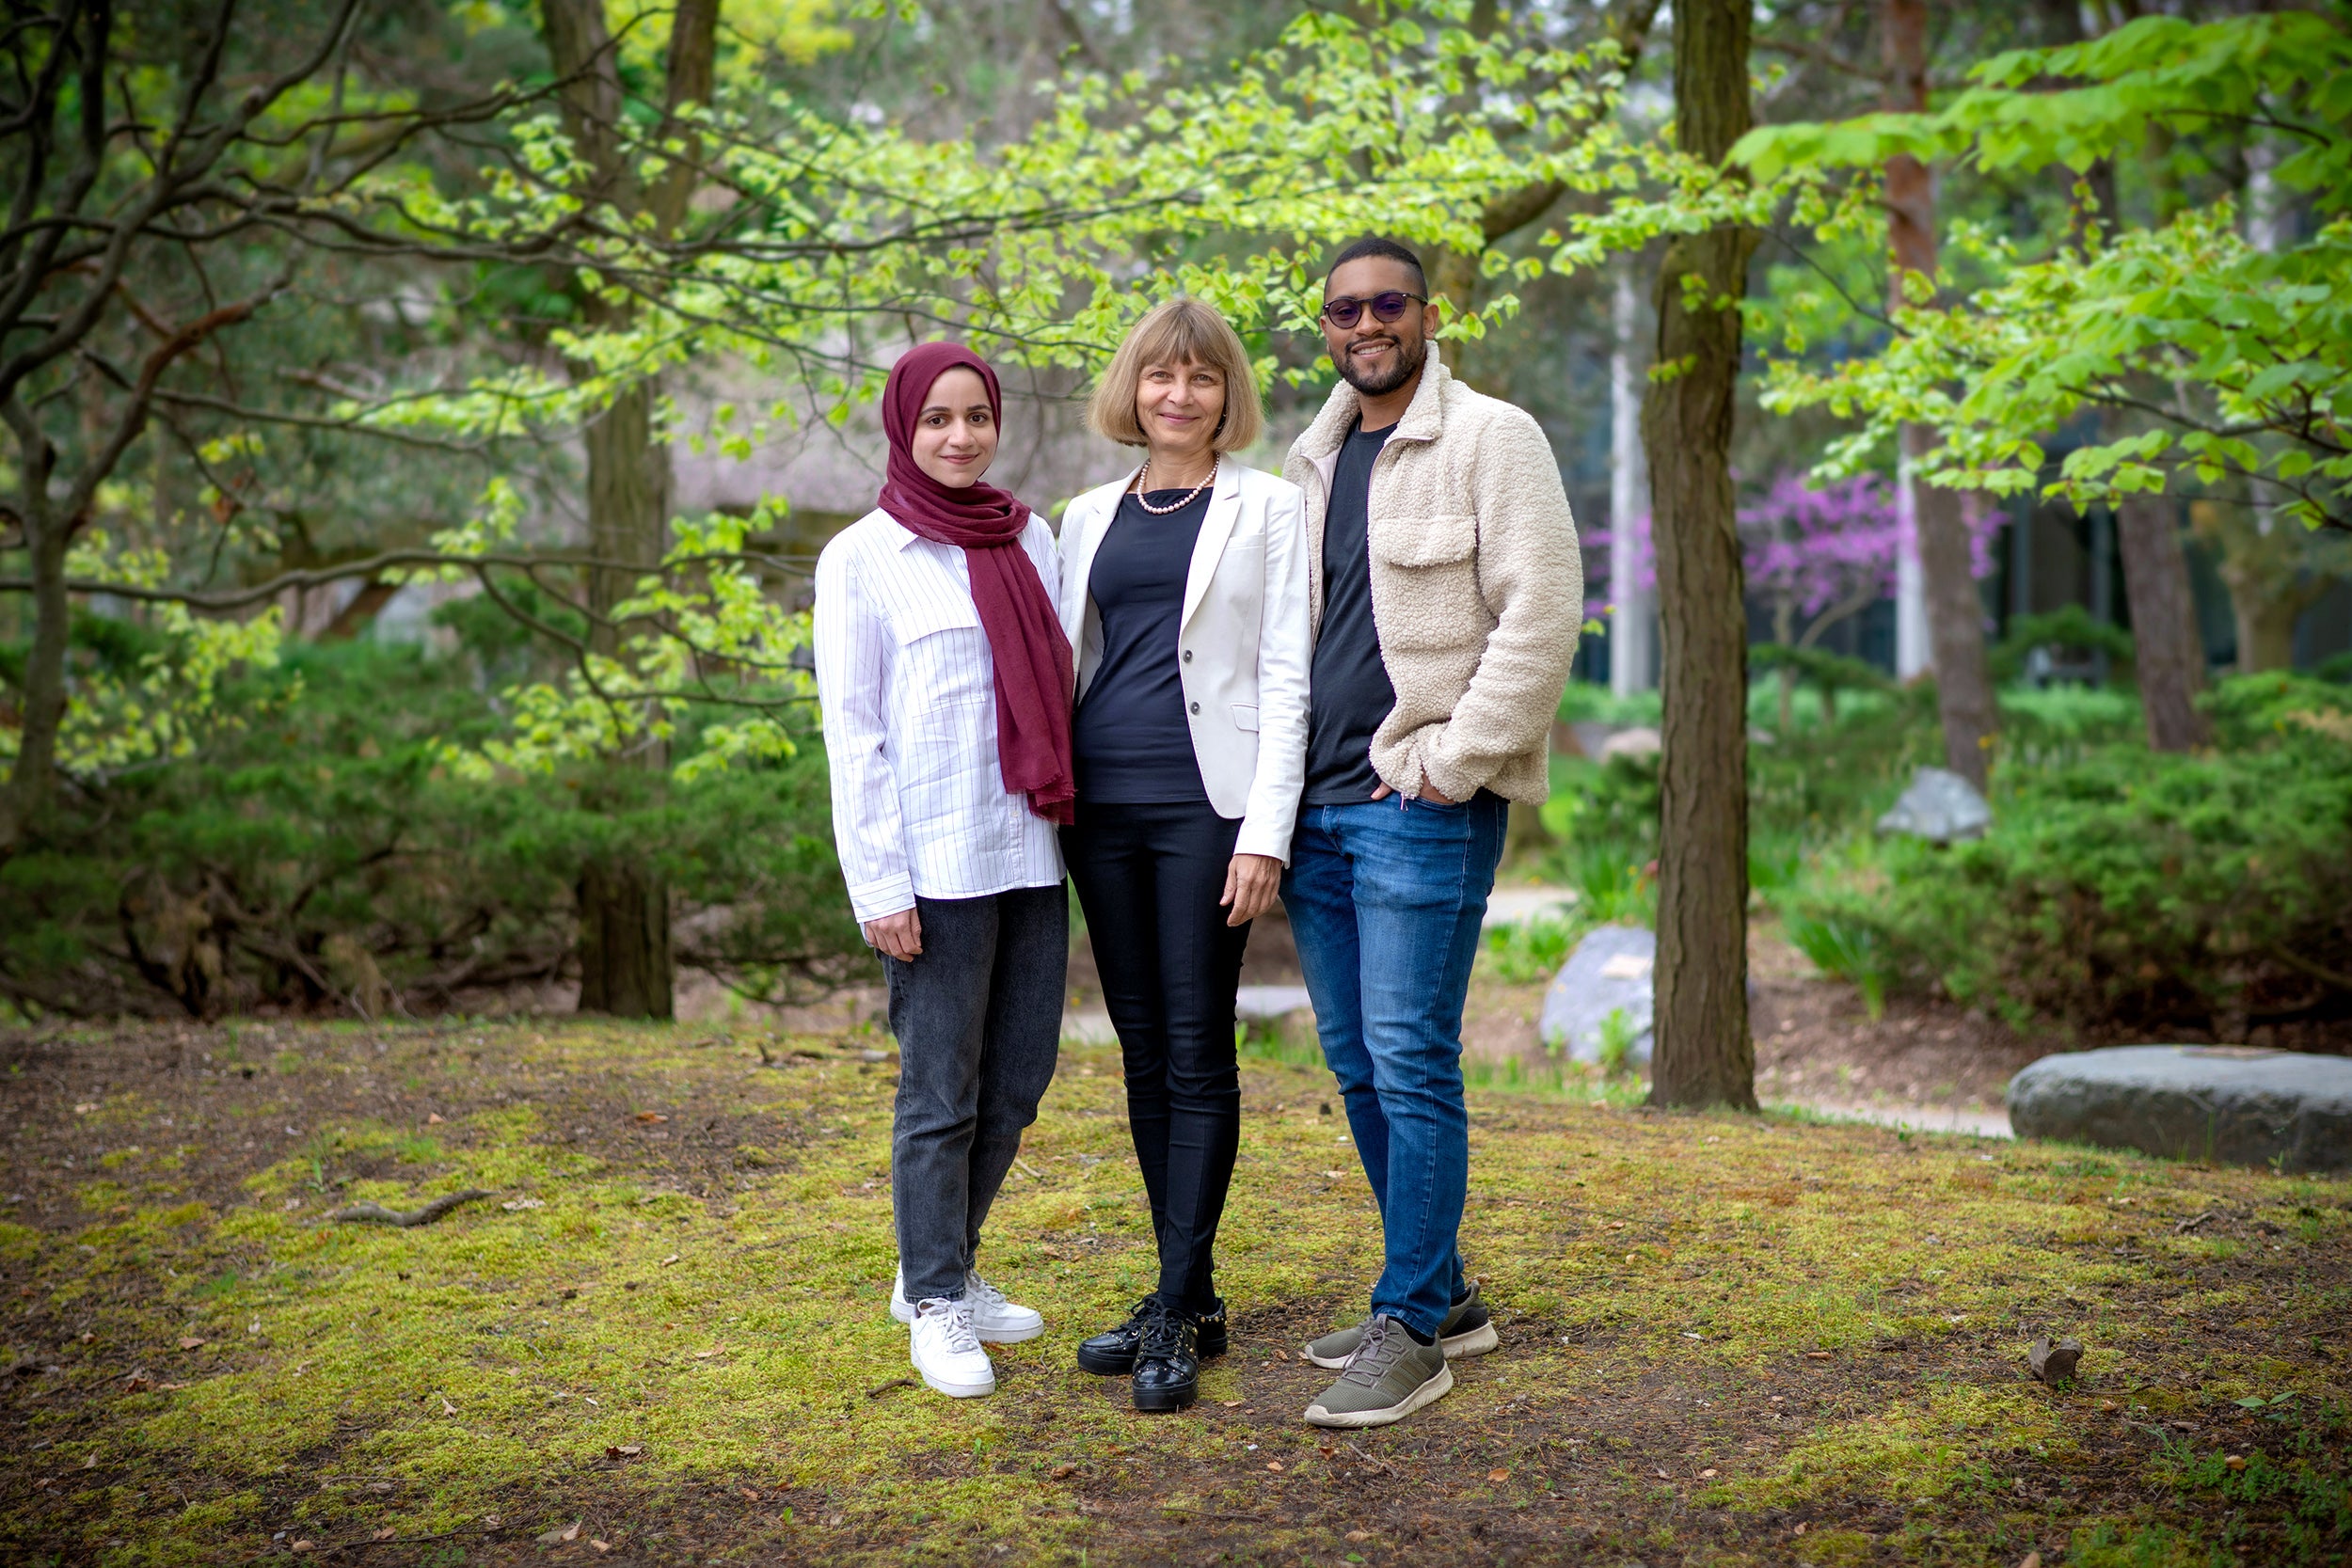
L to R: PhD student Fatemeh Alipour, Professor Lila Kari and PhD student Pablo Millán Arias. Professor Kathleen Hill from Western University was unavailable for the photo.
Fatemeh’s research interests are in DNA sequence classification using alignment-free methods with applications for virus–host co-evolution. Pablo Millán Arias’s research interests span DNA classification to computer vision and image pattern recognition to theoretical computer science. Lila Kari is a Professor and University Research Chair in the Cheriton School of Computer Science. Author of more than 200 peer-reviewed articles, she is regarded as one of the world’s experts in biomolecular computation — using biological, chemical and other natural systems to perform computations.
“The evolutionary relationships that DeLUCS determines match true taxonomic groups with very high accuracy, ranging from 77 per cent right up to 100 per cent across a range of genetic datasets from organisms as diverse as vertebrates, bacteria and viruses,” Professor Kari said.
But before the computational method that DeLUCS uses to determine relationships can be understood, the structure of DNA and how genomic data is processed by computers needs to be described.
DNA is a molecule inside cells that contains the genetic information for the development and functioning of an organism. DNA is a double-helix polymer, a long spiral molecule consisting of two DNA strands wound around each other. Each strand has a backbone made of alternating sugar molecules called deoxyribose and phosphate groups. Attached to this backbone are sequences of four bases — molecules known as adenine (A), cytosine (C), guanine (G) or thymine (T). The sequence of these bases along the backbone encodes information, the instructions the cell uses to make protein molecules that carry out the functions of life.

DNA is a double-helix molecule formed by base pairs (adenine and thymine depicted in blue, guanine and cytosine depicted in orange) attached to a sugar-phosphate backbone (in grey).
One way to represent the one-dimensional sequence of bases in DNA graphically is to plot them using a technique known as chaos game representation or CGR.
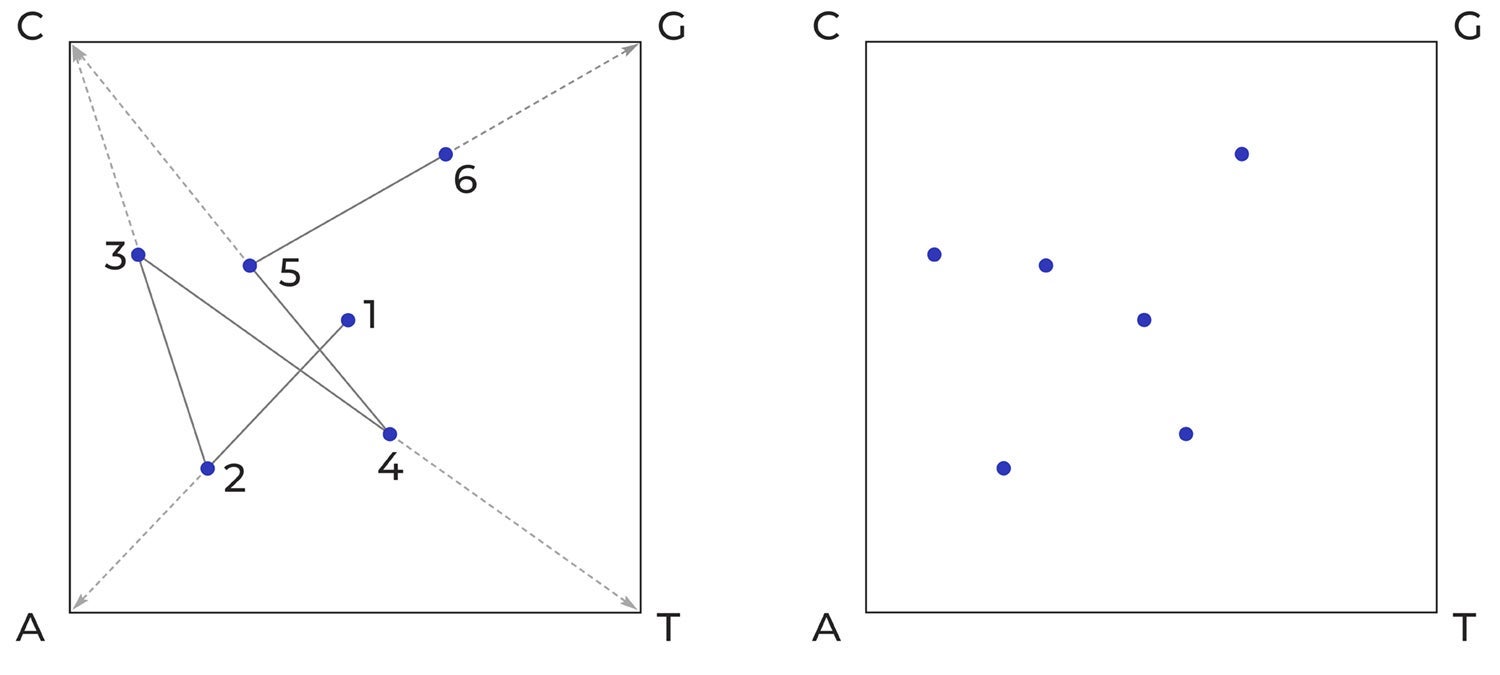
“The idea of CGR is to represent a DNA sequence as an image,” Professor Kari explains. “You start with a unit square with the corners labelled by the four bases: C G A T. The first pixel in the image is in the centre. The DNA sequence is read from left to right, and for each base that is read a new pixel is plotted halfway on the segment determined by the current pixel and the corner labelled by the next DNA letter being read.”

How chaos game representation (CGR) transforms a linear sequence of adenine (A), cytosine (C), thymine (T), and guanine (G) bases in DNA into a graphic pattern. This example shows the short sequence ACTCG being plotted (image on left), which results in a pattern (image on right) that a computer can process.
A dot is plotted at the centre of the square (1). Then a line is drawn from the centre dot to the corner that corresponds to the first nucleotide (A in this example) in the DNA sequence. A new dot is then plotted at the midpoint of that line (2). Then a line is drawn from that dot to the corner corresponding to the next nucleotide (C) in the sequence. The next dot is placed at the midpoint of that line (3). The process is continued until all six nucleotides (ACTCG) have been plotted, resulting in the simple graphic image on the right.
“If you do this for longer, real-life DNA sequences, you find interesting patterns,” Professor Kari continued. “But, more importantly, it turns out that genomic CGRs are species specific. In other words, CGR patterns from the same species look similar and patterns from different species look different, and the differences between the patterns are proportional to how different the species are genetically and hence evolutionarily. Interestingly, the pattern is preserved regardless of the length and the location of the subsequence sampled, provided you sample a sequence of at least 5,000 base pairs. For these reasons, CGR qualifies as a genomic signature — a quantitative value that is similar for genomes from the same species.”

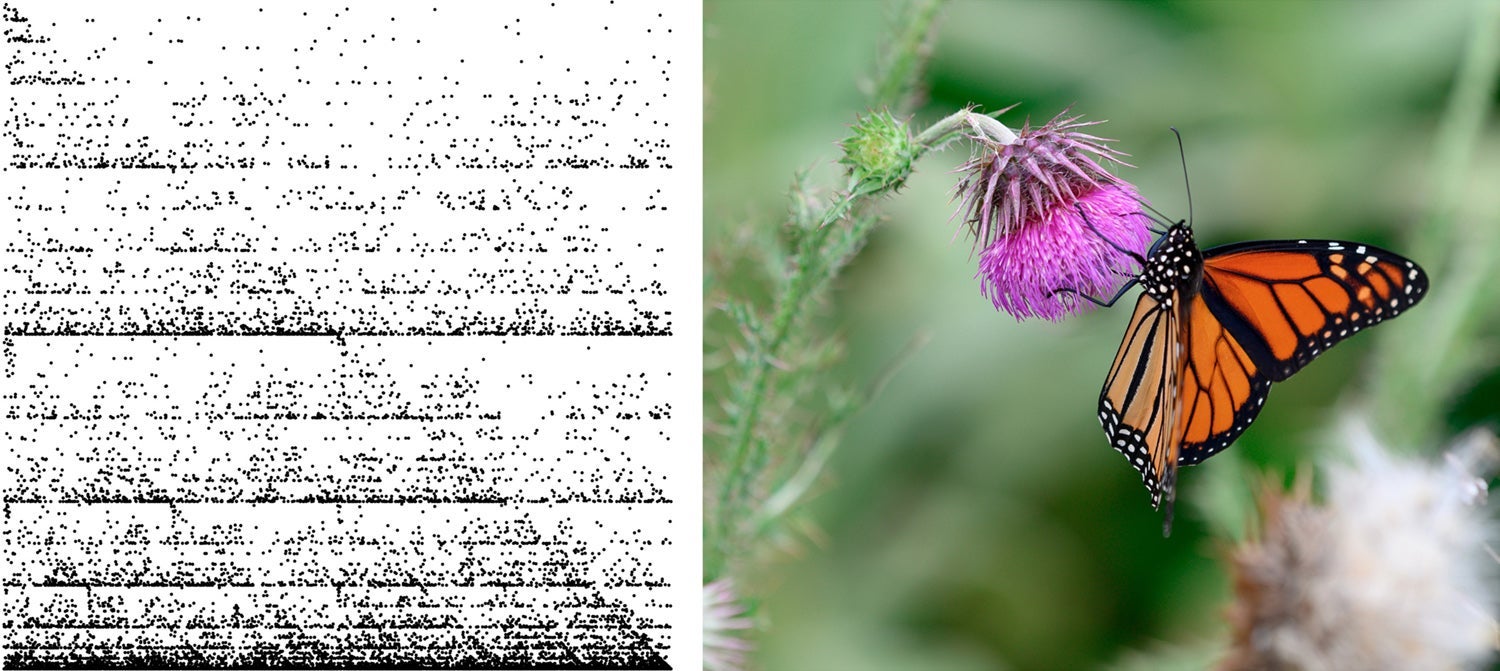
A CGR representation (left) of the complete mitochondrial genome of the monarch butterfly (Danaus plexippus) (right), a familiar North American butterfly and iconic pollinator species.
To compare genomes of organisms, Professor Kari and her team used a quantized version of CGR called frequency CGR. It is similar to a CGR representation of a genome, but FCGR includes even more information from an organism’s genome — the frequency of k-mers in the DNA sequences, in other words, various substrings of nucleotides of length k in a given DNA sequence. With this k-mer information you know how many times a particular nucleotide sequence, say ACTCG, occurs in a genome. The FCGRk of a DNA sequence is a two-dimensional unit square CGR image, with the intensity of each pixel representing the frequency of a particular k-mer in the sequence.
“DeLUCS is an unsupervised machine learning technique,” Professor Kari said. “In a supervised machine learning scenario, you teach the algorithm by giving it a huge training set of labelled data — in simple terms, you tell the algorithm this is a monkey, this is an elephant, this is a dog, and so on. After you train the model, you give it new data and ask it to determine what it is. In unsupervised learning, we give the algorithm nothing — just the blind FCGR matrices — from which it finds patterns that can be used to create clusters. This method has an accuracy of almost 80 per cent and often much better.”
In their approach, FCGR pairs of sequences and of their mimics are generated and used as input to an artificial neural network.
“The initial idea came from computer vision and we adapted it for DNA sequences,” Professor Kari said. “We take a sequence and we don’t know what it is. We don’t know what cluster it belongs to, but we want to cluster them by taxonomic groups — by genus, by family, by order, and so on. What we do is slightly perturb the DNA sequence — by about 2 per cent — by inserting, deleting and substituting nucleotides, thereby creating a new sequence, but we know for sure that this mimic belongs to the same cluster. Once we do that, batches of pairs of FCGRs — the FGCR of the DNA sequence and the FGCR of the mimic sequence — are fed as input into an artificial neural network, which uses an optimization process to learn clusters. This is the novelty of this approach. To the best of our knowledge, this is the first alignment-free method that uses deep neural networks for unsupervised clustering of unlabelled DNA sequences.”
The only information external to the DNA sequence used by DeLUCS is the requirement that all genetic sequences come from the same kind of DNA — sequences from the DNA in the nucleus of cells, the DNA in the mitochondria in eukaryotic cells, the DNA in the chloroplasts in plants cells, and so on.
“One of the reasons we used mitochondrial DNA rather than nuclear DNA to determine taxonomic groups within vertebrates is because mitochondrial DNA is short enough that we can use all of it,” Professor Kari explains. “We eliminate all kinds of design decisions by sticking to mitochondrial DNA. But another advantage of using mitochondrial DNA is that you can often also look at extinct species. If you extract nuclear DNA from the tooth or bone of a Neanderthal specimen, the nuclear genome is too long to be intact, but the mitochondrial DNA is short enough that you might have the full sequence available.”
Professor Kari says that along with determining evolutionary relationships between extinct and extant species, information essential for reconstructing the tree of life, knowing evolutionary relationships has many other practical benefits.
“If we can classify bacteria quickly into strains that are antibiotic resistant versus not this information would be very useful therapeutically,” she says. “It would also be extremely useful if we can quickly detect whether a new COVID strain has evolved or if a novel virus is closely related to one known to be highly infectious and deadly.”
But there’s another pressing reason.
“We are in the midst of a global mass extinction event,” Professor Kari said. “Hundreds of species disappear every week and we cannot protect what we don’t know is disappearing. We can’t fix everything at once, but we may be able to save species most at risk of extinction. Perhaps DeLUCS can help us identify them so we can direct resources and purposeful action where they are most needed.”
To learn more about the research on which this feature is based, please see Pablo Millán Arias, Fatemeh Alipour, Kathleen A. Hill, Lila Kari. (2022) DeLUCS: Deep learning for unsupervised clustering of DNA sequences. PLoS ONE 17(1): e0261531.